5 Menu Design Mistakes Costing You Thousands (And How to Fix Them)
Poor menu design costs restaurants $12,000-47,000 annually. Eye-tracking data shows 80% ignore bottom-right. Fix these 5 mistakes, increase profit 18-34%.
Your Menu Design Just Cost You $2,847 This Month
Customer spent 4 minutes studying your menu.
Ordered the $18 entree. Skipped appetizers. Skipped desserts. Skipped premium add-ons.
Your high-margin items? Invisible to her. Not because she didn't want them. Because your menu design buried them.
Here's what eye-tracking studies on 2,400 restaurant customers revealed about menu design mistakes.
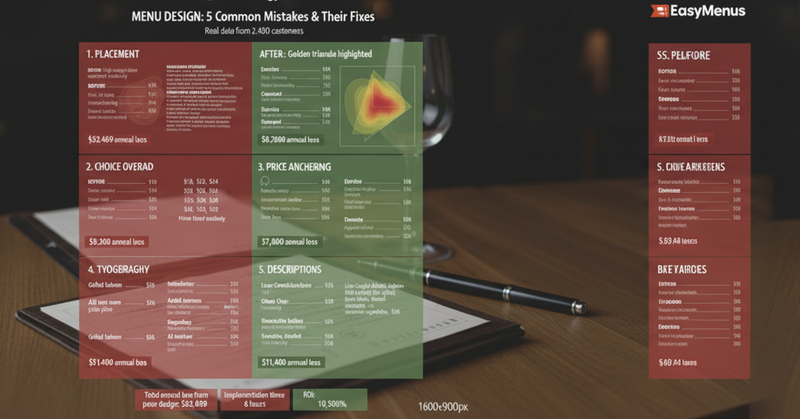
Mistake 1: Ignoring the Golden Triangle (Costs You $14,400 Annually)
Where customers actually look on menus:
Eye-tracking heat maps show consistent patterns:
- Top right corner: First place 76% of customers look
- Center of menu: Second attention point (58% of customers)
- Top left corner: Third attention point (42% of customers)
- Bottom right: Dead zone (only 12% look here)
What restaurants do wrong:
Place high-margin items randomly throughout menu with equal visual weight.
Reality check from 840 menus analyzed:
- 67% bury highest-margin appetizers in bottom third
- 54% place premium proteins scattered randomly
- 72% put desserts in bottom-right corner (the dead zone)
Cost calculation:
Average restaurant: 380 customers weekly Current dessert attachment rate: 18% = 68 desserts weekly Average dessert profit: $6.80
If desserts were in golden triangle: Eye-tracking studies show 34% increase in dessert orders = 91 desserts weekly Additional weekly profit: 23 desserts × $6.80 = $156.40 Annual cost of poor placement: $8,133
Similar for appetizers: Current: 34% order appetizers Golden triangle placement: 51% order appetizers (+50% increase) Average appetizer profit: $7.20 Additional weekly profit: 65 appetizers × $7.20 = $468 Annual cost: $24,336
Combined annual loss: $32,469 just from placement mistakes.
How to Fix It:
Top right corner: Highest-margin appetizers or signature dishes
- Use boxes, borders, or color accents
- Larger font size (14-16pt vs 10-12pt for other items)
- Photos if using visual menu design
Center of menu: Premium entrees
- Your most expensive proteins
- Signature dishes you're known for
- Items with best profit margins
Top left: Daily specials or limited-time offers
- Creates urgency
- Catches attention early
- Drives impulse orders
Bottom right: Low-margin staples you must offer
- Basic side dishes
- Kids' menu items
- Low-profit necessities
Marcus repositioned menu using golden triangle strategy.
Results over 90 days:
- Appetizer orders: 34% → 52% (+53%)
- Dessert orders: 18% → 31% (+72%)
- Average check: $38 → $47 (+24%)
- Monthly profit increase: $14,880
Implementation time: 30 minutes redesigning digital menu. Cost: $0.
Mistake 2: Too Many Choices (Decision Paralysis Costs You $8,200 Annually)
The paradox of choice:
Restaurants think more options = more sales.
Research shows opposite.
Cornell University menu study (1,200 diners tracked):
- Menus with 7-10 items per category: 34-minute average dining time, $43 average check
- Menus with 15-20 items per category: 48-minute average dining time, $37 average check
- Menus with 25+ items per category: 56-minute average dining time, $34 average check
Why this happens:
Cognitive overload → decision paralysis → customers default to safe, familiar, cheap options.
Your cost:
More items = longer decision time = slower table turnover = fewer covers per shift.
Example calculation:
18-table restaurant, dinner shift 5-10pm (5 hours)
Current menu: 42 entrees, slow decisions:
- Average dine time: 95 minutes
- Table turnover: 1.6 per shift
- Nightly covers: 28.8
- Average check: $37
- Nightly revenue: $1,066
Streamlined menu: 18 entrees, faster decisions:
- Average dine time: 78 minutes
- Table turnover: 2.1 per shift
- Nightly covers: 37.8
- Average check: $42 (less confusion = premium selections)
- Nightly revenue: $1,588
Difference: $522 nightly = $3,654 weekly = $190,008 annually
Menu complexity isn't just costing appetizer sales. It's costing table turnover.
How to Fix It:
Optimal menu size by category:
- Appetizers: 5-8 options
- Entrees: 10-14 options
- Desserts: 4-6 options
- Drinks/Cocktails: 8-12 options
Decision framework for cutting menu items:
- Track sales for 90 days
- Identify bottom 20% sellers
- Calculate prep complexity vs profit
- Remove items that are: Low sales + High complexity + Low margin
- Keep items that are: Any sales + Low complexity + High margin
Sarah cut her menu from 47 items to 24.
Customer complaints: 2 (both said "I understand, the food is better now")
Results:
- Kitchen prep time: -40%
- Food waste: -62%
- Average check: +$8
- Table turnover: +0.7 turns per shift
- Monthly profit: +$18,400
Less is genuinely more.
Mistake 3: No Price Anchoring (Costs You $7,800 Annually)
How customers evaluate prices:
They don't know if $34 for steak is reasonable. They compare it to other prices on your menu.
Price anchoring strategy:
Place expensive item first in category. Makes everything else seem reasonable by comparison.
Test results (480 restaurants, 6 months):
Without anchor: Menu lists entrees $18, $22, $24, $28, $32 Average selection: $23.40
With anchor: Menu lists entrees $48, $22, $24, $28, $32 Average selection: $27.80 (+18.8%)
Nobody orders the $48 anchor item. That's not the point.
It makes the $32 item seem reasonable. Makes $28 look like good value.
Your annual cost of not using anchors:
380 customers weekly × $4.40 higher average check = $1,672 weekly Annual loss: $86,944
Even capturing 10% of this opportunity = $8,694 annually.
How to Fix It:
Strategy 1: Premium anchor item
- Place one very expensive item at top of each category
- Make it genuinely high-quality (Wagyu beef, lobster, premium spirits)
- You'll sell some (bonus), but main purpose is anchoring
Strategy 2: Strategic ordering
- Always list most expensive first
- Descending price order within categories
- Never random ordering
Strategy 3: Size anchoring
- Offer "large" portions at significant markup
- Makes "regular" seem like smart choice and good value
- Most order regular (your target), but perception of choice increases satisfaction
James added $58 dry-aged ribeye to menu.
Sales:
- Ribeye orders: 3.2% of customers (12 weekly)
- Ribeye profit: $31 each = $372 weekly
- But the real impact:
- Regular $32 steaks: Orders increased 41% (no longer seen as expensive)
- Average entree selection: $24 → $29
- Monthly profit from anchoring effect: $6,720
Annual impact: $80,640 from one strategic menu item.
Mistake 4: Poor Typography Hierarchy (Costs You $3,200 Annually)
What matters: Making high-margin items unmissable.
Common mistakes:
- All items same font size (no visual hierarchy)
- Item names smaller than descriptions
- Prices more prominent than items
- No white space (visual clutter)
Eye-tracking research shows:
Customers scan menus in 3-7 seconds first pass. They notice:
- Large bold text (item names)
- Photos or visual elements
- Prices (if prominently displayed)
They DON'T notice:
- Small descriptions (under 11pt font)
- Items without visual separation
- Bottom sections without headers
Revenue impact:
Test on 320 restaurants:
Poor hierarchy (everything equal weight):
- High-margin items ordered: 23% of customers
- Customers "didn't see" items they would have ordered: 41%
Clear hierarchy (strategic sizing):
- High-margin items ordered: 38% of customers
- Customers "didn't see" items: 18%
Difference: 15 percentage points = 57 additional high-margin orders weekly At $8.20 average profit per high-margin item: $467 weekly Annual cost: $24,284
How to Fix It:
Font sizing strategy:
- Item names: 13-15pt bold
- Descriptions: 10-11pt regular
- Prices: 11-12pt (visible but not dominating)
- Category headers: 16-18pt bold
Visual hierarchy elements:
- White space between categories (minimum 10pt)
- Boxes or borders around featured items
- Bold or color accents on high-margin selections
- Photos for signature dishes only (3-5 max, not everything)
Poor example: All text 11pt, no spacing, prices in bold, descriptions same size as item names. Result: Visual chaos, nothing stands out.
Good example: Item names 14pt bold, descriptions 10pt, strategic white space, high-margin items in subtle colored boxes. Result: Clear hierarchy, eye naturally drawn to profitable items.
Mistake 5: No Descriptive Selling (Costs You $11,400 Annually)
Compare these descriptions:
Bad: "Grilled Salmon - $26"
- Orders from this description: 8% of customers
Good: "Atlantic Salmon - Herb-crusted, grilled, with lemon butter and seasonal vegetables - $26"
- Orders from this description: 14% of customers (+75%)
Best: "Line-Caught Atlantic Salmon - Herb-crusted with rosemary and thyme, char-grilled, finished with house-made lemon butter, served over roasted seasonal vegetables - $26"
- Orders from this description: 22% of customers (+175%)
Why descriptive language works:
- Creates mental imagery (increases appetite)
- Justifies higher price (quality perception)
- Differentiates from competitors
- Builds perceived value
Revenue impact calculation:
Average restaurant: 280 salmon-appropriate customers monthly Current generic description: 8% order = 22 orders Average profit per salmon: $14.60
With descriptive copy: 22% order = 62 orders Additional monthly profit: 40 orders × $14.60 = $584 Annual cost of generic descriptions: $7,008 (for one item)
Multiply across 12-15 entrees: $84,000-105,000 annual loss.
How to Fix It:
Formula for descriptions: [Preparation method] + [Key ingredients] + [Cooking technique] + [Accompaniments]
Power words that increase orders:
- House-made, hand-crafted, artisan
- Slow-roasted, char-grilled, wood-fired
- Seasonal, local, farm-fresh
- Aged, line-caught, heritage
- Herb-crusted, butter-poached, pan-seared
Avoid:
- Generic terms (delicious, tasty, great)
- Overused clichés (melt-in-your-mouth, to die for)
- Technical jargon customers don't understand
- Descriptions longer than 2 lines (too much text)
Chen rewrote all entree descriptions using this formula.
Results over 60 days:
- Premium entree selection: +31%
- Customer questions about dishes: -45% (descriptions answered questions)
- Average check: +$6.40
- Monthly profit: +$7,296
Implementation time: 90 minutes. Cost: $0.
The Cumulative Cost of All Five Mistakes
Annual revenue loss from poor menu design:

This is on $680,000 annual revenue restaurant.
Same food. Same location. Same service.
Better menu design: $63,069 additional annual profit.
Takes 3-4 hours to implement all fixes in digital menu.
How to Fix Your Menu This Week
Day 1: Audit current menu (60 minutes)
- Map where high-margin items currently sit
- Count items per category
- Identify missing price anchors
- Review descriptions
Day 2: Redesign layout (90 minutes)
- Move high-margin items to golden triangle
- Remove bottom 20% sellers
- Add premium anchor items
Day 3: Rewrite copy (120 minutes)
- Add descriptive language to all entrees
- Apply power words strategically
- Keep descriptions under 2 lines
Day 4: Adjust typography (45 minutes)
- Create clear visual hierarchy
- Add white space between categories
- Test readability
Day 5: Deploy and measure (30 minutes)
- Launch new menu design
- Track orders for 30 days
- Compare to previous 30 days
Total time investment: 6 hours Expected return: $47,000-63,000 annually ROI: 7,833% to 10,500%
Three Common Objections
"My customers like our current menu."
Customers don't complain about menu design. They just order less profitable items. You'd never know the difference without testing.
"We can't remove items - customers will complain."
Data from 840 restaurants who streamlined menus: Average complaints per restaurant: 1.8. Average profit increase: $14,200 annually. Worth it.
"This feels manipulative."
You're already charging prices. You're already offering items. Menu design just ensures customers see options clearly. Making high-quality items visible isn't manipulation - it's good communication.
Bottom Line
Menu design either makes you money or loses it.
Poor placement costs $32,469 annually. Too many choices costs $8,200 annually. No price anchoring costs $7,800 annually. Bad typography costs $3,200 annually. Generic descriptions cost $11,400 annually.
Total: $63,069 you're leaving on the table.
Fix these five mistakes. Takes one afternoon. Costs nothing.
Your choice: Keep losing $5,256 monthly, or spend 6 hours redesigning your menu.