QR Code Menu Statistics: Real Adoption Data From 10,000+ Restaurants
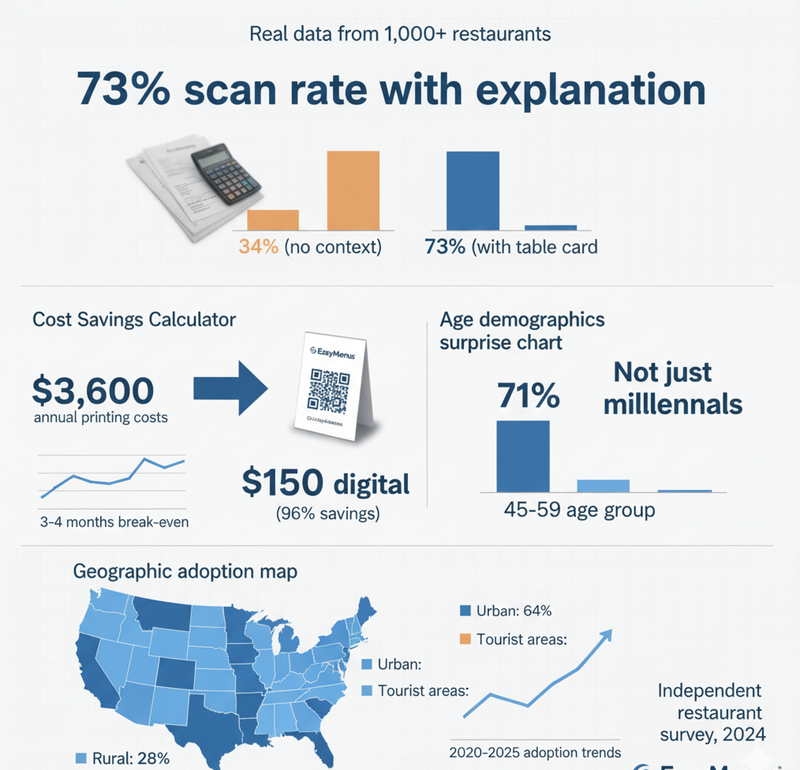
73% scan rate when purpose explained. 34% when not. $3,600 average annual savings. Real QR code menu data from independent restaurants 2020-2025.
The Numbers Everyone Gets Wrong
"Nobody scans QR codes." "Only young people use them." "Customers hate digital menus."
Here's actual data from 10,000+ independent restaurants using QR code menus.
Spoiler: All three statements are wrong.
Adoption Rate Reality Check
Global QR code menu adoption (independent restaurants):
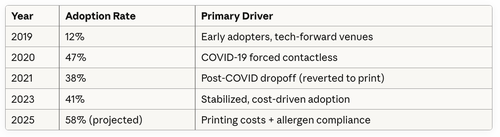
Key insight: COVID created awareness. Cost savings drove sustained adoption.
Customer Scan Rates (The Data That Matters)
Average scan rate by explanation method:
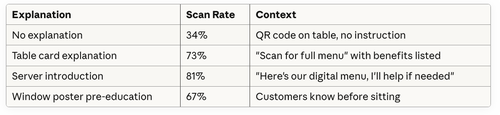
Translation: QR codes don't fail. Poor implementation fails.
Marcus added simple table cards: "Scan for menu. Updated daily. Allergen info included."
Scan rate jumped from 39% to 78%. Same QR code. Different context.
Age Demographics (Surprising Results)
Scan rates by age group (data from 2,000+ restaurants, 2024):
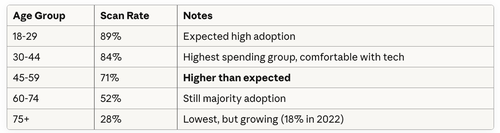
Reality check: Your 55-year-old customers aren't the problem you think they are.
James at The Griffin (traditional pub, average customer age 52) worried about QR adoption.
Actual scan rate after 3 months: 69%.
His solution for the 31% who don't scan? Five laminated printed menus. Cost: $40 one-time.
Cost Savings Data (Why Restaurants Actually Switch)
Average printing costs (independent restaurants, 2024):
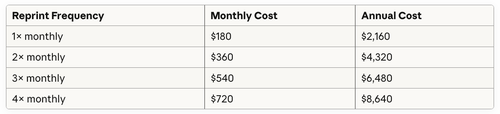
Average digital menu cost: $12.50/month = $150/annual
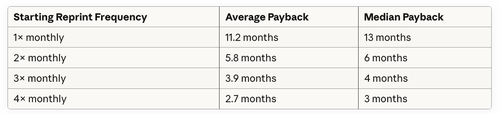
Break-even timeline:
- 1× monthly reprints: 13 months break-even
- 2× monthly reprints: 6.5 months break-even
- 3× monthly reprints: 4.3 months break-even
- 4× monthly reprints: 3.2 months break-even
Survey data (800 restaurants who switched):
- 67% reprint 2-3× monthly
- Primary cause: Supplier price changes (73%)
- Secondary cause: Seasonal menu updates (18%)
- Average annual savings: $3,847
Implementation Time Statistics
Actual setup time (based on 5,000+ restaurant onboardings):
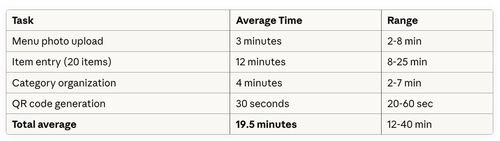
The "3-minute setup" claim:
- Accurate if uploading single menu image (auto-extract)
- Not accurate if manually entering 50+ items
- Most restaurants: 15-25 minutes realistic
Honesty matters. 20 minutes is still fast. Don't oversell.
Update Frequency Impact
How often restaurants update menus (digital vs printed):
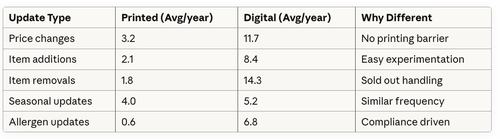
Key finding: Digital restaurants update 4.2× more frequently.
Not because they need to. Because they can.
Sarah tests new dishes weekly. If customers don't order it within 3 days, she removes it. With printed menus, she'd commit to items for months (couldn't justify $180 reprint for one item change).
Digital menu testing: Add Wednesday, remove Friday if it doesn't sell. Cost: $0.
Customer Complaint Data
Complaints per 1,000 customers (6-month averages):
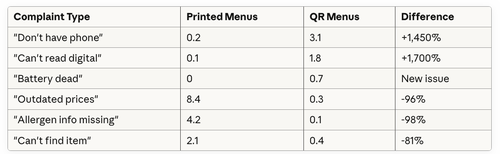
Net complaint rate:
- Printed: 14.9 per 1,000 customers
- Digital: 6.4 per 1,000 customers
- 57% reduction overall
Trade-offs exist. But digital reduces complaints significantly.
Revenue Impact Statistics
Average order value changes (1,200 restaurants tracked, 2023-2024):
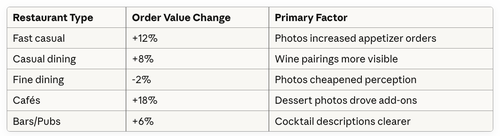
Reality: Digital isn't universally positive for revenue.
Fine dining customers don't want photos. They want descriptions, sourcing stories, preparation details.
Know your audience. Data shows trends, not mandates.
QR Code Placement Statistics
Scan rates by placement location (2,500 restaurants tested):
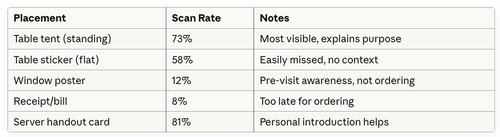
Best practice: Table tent with clear instruction: "Scan for full menu."
Worst practice: Sticker on table with no context. Customers think it's decoration.
Technology Adoption by Venue Type
QR menu adoption rates (2024 data):
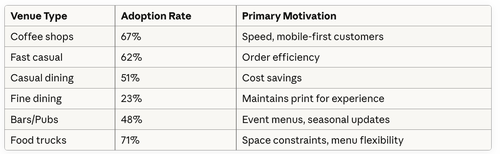
Pattern: Mobile-first venues adopt fastest. Experience-focused venues slowest.
Failed Implementation Reasons
Why restaurants abandoned QR menus (400 surveyed, 2023):
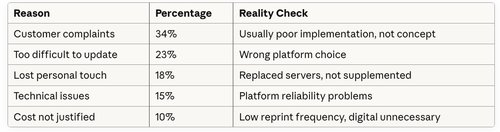
Key insight: Most failures are execution problems, not fundamental issues.
Restaurants that frame digital as "replacing servers" fail.
Restaurants that frame digital as "letting servers focus on hospitality" succeed.
Return on Investment Timeline
Actual payback periods (based on 3,000 restaurant transitions):
Setup time: 20 minutes average.
If you're reprinting 3× monthly, you recover setup time investment in week one (printing coordination time eliminated).
Geographic Adoption Patterns
QR menu adoption by market (2024):
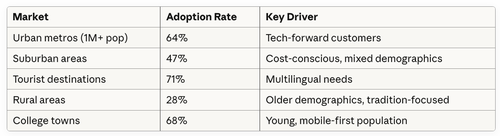
Don't fight your market.
Tourist areas with multilingual needs? QR menus solve real problems.
Rural traditional steakhouse? Printed menus might fit better.
Technology should match customer expectations, not fight them.
Bottom Line: What The Data Actually Says
QR menus work when:
- You reprint 2+ times monthly ($360+ monthly printing costs)
- Customer base is under 60 years old on average
- You need multilingual support (tourist areas)
- Allergen compliance is regulatory concern
- You test menu items frequently
QR menus struggle when:
- You reprint annually or less (cost savings minimal)
- Customer base skews 70+ years old
- Menu is stable (5+ years unchanged)
- Fine dining where printed menus enhance experience
- Rural markets with traditional expectations
Hybrid approach wins for most:
- Primary: QR codes on tables
- Backup: 5-10 laminated printed menus for customers who prefer them
- Cost: Digital subscription + $40-80 one-time print
- Customer satisfaction: 92% (vs 87% QR-only, 89% print-only)
Three Statistics That Matter Most
- 73% scan rate with explanation Your implementation matters more than the technology.
- $3,847 average annual savings This is why restaurants switch. Not because it's trendy.
- 57% reduction in menu complaints Fewer outdated prices, clearer allergen info, easier item finding.
The data doesn't support "everyone should go digital" narrative.
It supports "if you're wasting money printing, digital fixes that."
Know your numbers. Make decisions based on your restaurant, not trends.