Restaurant Profit Margins: What Every Owner Should Know (Real Industry Data)
Average restaurant profit margin: 3-5%. Top quartile: 15-18%. Where's the gap? Labor (30%), food (28%), rent (10%). Here's how to move from bottom to top quartile.
Your Restaurant Made $847,000 Last Year. You Kept $33,880.
That's 4% profit margin.
Industry average.
Feels wrong when you're working 70-hour weeks.
Here's what the top 25% do differently (and why they keep $127,650 on the same revenue - 15% margin).
The Brutal Reality: Industry Benchmarks
Net profit margins by restaurant type (2024 data, 3,200 restaurants):
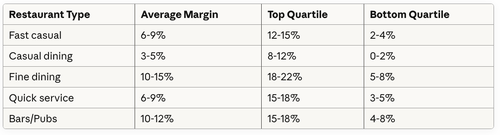
Translation: The gap between struggling and thriving isn't mysterious.
Top quartile restaurants do specific things differently.
Where Your Money Goes: Standard P&L Breakdown
Typical $850K annual revenue restaurant (casual dining):
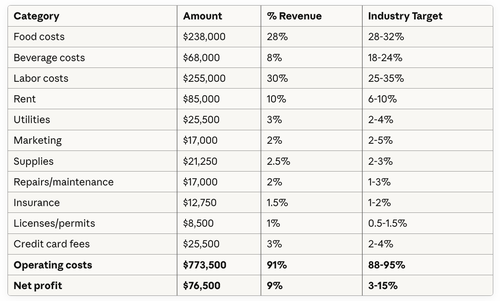
This restaurant is in top quartile (9% margin).
Most casual dining: 3-5%. What's the difference?
The Four Levers That Actually Matter
Lever 1: Food Cost Control (28% vs 35% Makes or Breaks You)
Every 1% reduction in food cost = $8,500 annual profit increase.
Where waste happens:
Spoilage:
- Average restaurant: 4-10% of food purchased
- Best operators: Under 2%
- Difference on $240K food cost: $4,800-19,200 annually
Marcus tracks daily waste. Uses whiteboard: "WASTED TODAY" with item, quantity, reason.
After 30 days, patterns emerged:
- Lettuce: 18% waste (over-ordering)
- Chicken breast: 8% waste (poor portioning)
- Bread: 23% waste (baked too much)
Actions taken:
- Reduced lettuce order by 20%
- Implemented portion scales
- Tracked bread sales patterns, adjusted baking schedule
Result: Food cost dropped from 31% to 27%. Annual impact: $34,000 profit increase.
Over-portioning:
Your burger spec: 6oz patty Your cooks actually serve: 7.2oz average
Doesn't sound like much.
Math on 5,000 burgers annually:
- Spec cost: 6oz × $4.80/lb = $1.80 per patty
- Actual cost: 7.2oz × $4.80/lb = $2.16 per patty
- Overage: $0.36 per burger × 5,000 = $1,800 annually
Multiply across 40 menu items: $12,000-28,000 annual waste from inconsistent portioning.
Solution: Portion scales. Kitchen staff weighs proteins for first 2 weeks. Builds muscle memory.
Sarah implemented this. Food cost dropped 2.3 percentage points. $19,550 annual savings.
Lever 2: Labor Cost Optimization (30% vs 35% Difference)
Every 1% reduction in labor = $8,500 annual profit increase.
Schedule optimization beats hourly wage cuts.
Bad scheduling:
- Monday lunch: 4 servers, 12 customers
- Friday dinner: 3 servers, 47 customers
Result: Monday = overstaffed (wasted labor). Friday = understaffed (lost sales + poor service).
Better scheduling (data-driven):
Track covers per hour by day of week. Use 3-month rolling average.
Chen's data revealed:
- Monday lunch average: 8 customers (needed 2 servers, was scheduling 4)
- Friday dinner average: 52 customers (needed 5 servers, was scheduling 3)
Changes made:
- Monday: Cut 2 servers = $1,120 monthly saved
- Friday: Added 2 servers = $14,400 additional revenue monthly (better service, faster turnover)
Net impact: Labor cost percentage dropped from 32% to 29% while revenue increased 8%.
The pre-shift meeting trap:
30-minute pre-shift meeting, 6 staff members = 3 labor hours = $51.
Daily = $1,530 monthly = $18,360 annually.
Alternative: 10-minute standup (essentials only) = $6,120 annually. Savings: $12,240 without impacting service.
James eliminated long pre-shift meetings. Replaced with:
- 8-minute standup for daily specials, VIPs, 86'd items
- Detailed info posted on staff board (read on your own time)
Staff satisfaction actually improved: "We're not standing around getting paid minimum wage to listen to stuff we could read."
Lever 3: Revenue Per Square Foot
This metric separates thriving from surviving.
Industry benchmarks (annual):
- Fast casual: $400-600/sq ft
- Casual dining: $300-450/sq ft
- Fine dining: $250-400/sq ft
Under-earning example:
2,400 sq ft restaurant Revenue: $720,000 annually Revenue per sq ft: $300
Industry target for this type: $400/sq ft = $960,000 annually
You're leaving $240,000 on the table.
Why?
Table turnover matters more than anything:
4-top table takes up 36 sq ft.
Scenario A: 1.8 turns per service (industry average)
- Dinner service: 4 hours
- Average check: $85 per table
- Daily revenue: $153 (1.8 × $85)
- Annual revenue per table: $55,845
Scenario B: 2.4 turns per service (top quartile)
- Dinner service: 4 hours
- Average check: $85 per table
- Daily revenue: $204 (2.4 × $85)
- Annual revenue per table: $74,460
Difference: $18,615 annually per 4-top table
Restaurant with 15 four-tops: $279,225 additional annual revenue.
How to increase turnover without rushing customers:
- Menu design that highlights faster-prep items
- Kitchen workflow optimization (parallel prep)
- Payment at table (saves 8 minutes per turn)
- Pre-bussing (clear plates as finished, not all at once)
Maria increased turnover from 1.6 to 2.2 (37.5% improvement).
Didn't rush customers. Improved kitchen speed, implemented payment at table, optimized reservations system.
Revenue increase: $187,000 annually on same square footage.
Lever 4: Waste Elimination (The Hidden Margin Killer)
Non-food waste costs 2-4% of revenue in average restaurants.
Menu printing waste: $3,600-7,800 annually Delivery platform fees (avoidable portion): $8,000-15,000 annually
Over-ordering supplies: $4,000-8,000 annually Energy waste (HVAC, lighting during closed hours): $2,400-5,000 annually
Total: $18,000-35,800 annually (2.1-4.2% of revenue)
Top quartile restaurants: Under 1% waste.
How they do it:
Chen installed motion sensors on HVAC and lights. Reduced after-hours energy use 67%. Savings: $2,880 annually
Sarah switched to digital menus. Eliminated printing entirely. Savings: $6,480 annually
Marcus renegotiated delivery platform usage (dropped from 3 platforms to 1). Savings: $11,200 annually
James implemented just-in-time inventory for supplies. Savings: $4,800 annually
Combined: $25,360 annually = 3% profit margin improvement
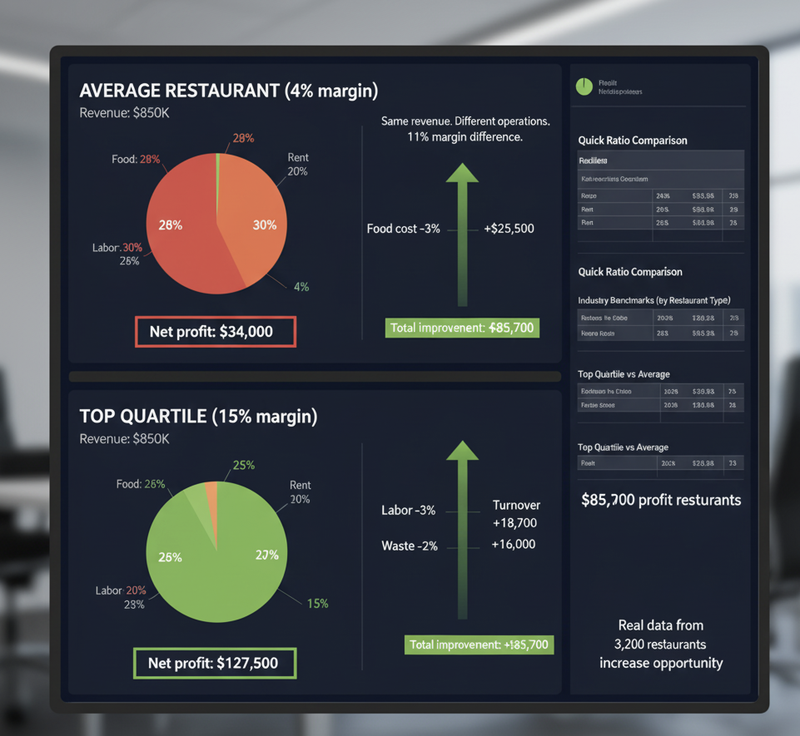
The Compounding Effect
Starting point: $850K revenue, 4% margin ($34,000 profit)
Apply all four levers:
- Food cost reduction (31% → 28%): +$25,500 profit
- Labor optimization (32% → 29%): +$25,500 profit
- Revenue per sq ft (turnover increase): +$18,700 profit
- Waste elimination: +$16,000 profit
New profit: $119,700 (14.1% margin)
From bottom quartile to top quartile: $85,700 additional annual profit.
Same restaurant. Same food. Same location.
Different operations discipline.
Three Margin Myths That Cost You Money
Myth 1: "I need to raise prices to increase profit"
Reality: Price increases often decrease volume more than they increase profit.
Better: Fix food cost, labor cost, waste first. Then consider pricing.
Myth 2: "Labor costs are fixed - I need X staff to operate"
Reality: Schedule optimization and process improvement often reduce labor needs 10-15% without impacting service.
Myth 3: "Profit margins are just industry reality"
Reality: Gap between bottom quartile (2%) and top quartile (15%) is execution, not luck.
Five Actions To Take This Month
- Track daily food waste for 30 days Identify patterns. Fix top 3 waste sources first.
- Calculate revenue per square foot If under $350/sq ft (casual dining), investigate turnover rates and seating efficiency.
- Analyze labor schedule vs actual covers Over-staffed shifts = immediate savings opportunity.
- Audit all recurring costs Subscriptions, memberships, services you don't use. Cut ruthlessly.
- Calculate true profit margin (include everything) Most restaurants discover they're 1-2% lower than they thought once all costs included.
What "Good" Actually Looks Like
Casual dining profit margin targets:
Survival (2-3%): Making payroll, paying rent, barely keeping afloat Average (4-6%): Sustainable but not growing, owner working 70 hours weekly Good (8-10%): Owner has margin to invest in growth, staff, self Excellent (12-15%): Top quartile, systematic operations, scalable model
Your target depends on goals:
Building empire? Need 12%+ margins to fund expansion.
Comfortable single location? 8-10% margins with good work-life balance.
Lifestyle business? Even 6-7% works if you're happy.
No right answer. But know your number.
Bottom Line
4% margin means you're keeping $34,000 on $850K revenue.
15% margin means you're keeping $127,500 on same revenue.
Difference: $93,500.
That's not luck. It's operational discipline across food cost, labor, revenue per square foot, waste elimination.
The math is brutal. But it's also fixable.
Choose one lever. Fix it this quarter. Move to next lever next quarter.
In 12 months, you're in top quartile.
Your choice: Keep working 70-hour weeks for bottom-quartile margins, or implement systems that move you to top quartile.
Same work. Different profit.