Restaurant Profit Margins: What Every Owner Should Know (2025 Benchmarks)
Average restaurant profit margin: 3-6%. Top performers: 12-15%. Real breakdown of costs, margins by restaurant type, and how to move from bottom to top quartile.
Your restaurant did $850,000 last year. You worked 70-hour weeks. Paid yourself $42,000.
Your profit margin? 4.9%.
You tell yourself that's "about average" for restaurants. And you're right - the average independent restaurant operates at 3-6% net profit.
But top-performing restaurants in your category run 12-15% margins. Same food costs. Same rent. Different decisions on the 800 small things that compound.
Here's where those 6-9 percentage points hide, and how 200 restaurants moved from bottom quartile to top quartile in 18 months.
Industry Benchmark Margins (2025 Data)
Net Profit Margins by Restaurant Type:
Quick-Service / Fast Casual:
- Bottom quartile: 4-6%
- Average: 8-10%
- Top quartile: 12-16%
Casual Dining:
- Bottom quartile: 2-4%
- Average: 4-6%
- Top quartile: 8-12%
Fine Dining:
- Bottom quartile: 0-3%
- Average: 3-6%
- Top quartile: 8-12%
Food Trucks:
- Bottom quartile: 8-12%
- Average: 12-18%
- Top quartile: 18-25%
Food trucks run highest margins because fixed costs (rent, utilities) are 60-70% lower than brick-and-mortar.
Fine dining runs lowest margins because labor costs (skilled kitchen staff, front-of-house service) consume 35-45% of revenue vs 25-32% in casual dining.
Revenue Size Matters:
- Under $500K annual: 2-4% average margin
- $500K-1M annual: 4-7% average margin
- $1M-2M annual: 6-9% average margin
- $2M+ annual: 8-12% average margin
Scale improves margins because fixed costs spread across more revenue.
Standard Cost Breakdown (Industry Average)
Revenue: 100%
Cost of Goods Sold (Food & Beverage): 28-35%
- Food cost: 25-32%
- Beverage cost: 18-24%
- Blended: 28-35%
Labor Costs: 25-35%
- Kitchen staff: 12-18%
- Front-of-house: 10-15%
- Management: 5-8%
- Total: 25-35%
Occupancy Costs: 8-12%
- Rent: 6-10%
- Property taxes: 1-2%
- Insurance: 1-2%
Operating Expenses: 8-12%
- Utilities: 2-3%
- Marketing: 1-3%
- Repairs/maintenance: 1-2%
- Supplies: 1-2%
- Technology: 1-2%
- Professional services: 1-2%
Total Costs: 94-97% Net Profit: 3-6%
This is "average" - meaning half of restaurants perform worse than this.
Where Bottom Quartile Restaurants Leak Margin
Leak #1: Food Waste (5-8% Revenue Lost)
Industry average food waste: 8-12% of purchased food
Jake in Portland tracked waste for 30 days:
- Food purchased: $24,000
- Food wasted: $2,880 (12%)
- Waste as % of revenue: 8% (on $90,000 monthly revenue)
Common waste sources:
- Over-prepping: 38%
- Spoilage: 27%
- Plate waste (portions too large): 18%
- Cooking errors: 12%
- Dropped/damaged: 5%
Top quartile restaurants:
- Food waste: 3-5%
- Difference: 5-8 percentage points of margin
How top performers reduce waste:
- Daily prep based on reservations + historical data
- Smaller portion testing (reduce plate waste 40%)
- FIFO inventory strictly enforced
- Weekly waste audits (measure what you manage)
- Menu engineering (use same ingredients across dishes)
Sarah reduced waste from 11% to 4% in 6 months. Added 4.2 percentage points to net margin. On $75,000 monthly revenue, that's $3,150 monthly or $37,800 annually.
Leak #2: Menu Printing & Updates (1-2% Revenue Lost)
Bottom quartile restaurants:
- Reprint menus 3-4× monthly
- Cost: $660-880 monthly ($7,920-10,560 annually)
- As % of $850,000 revenue: 0.9-1.2%
Top quartile restaurants:
- Digital menus with instant updates
- Cost: $150 annually
- As % of $850,000 revenue: 0.02%
Difference: 0.88-1.18 percentage points of margin
This seems small until you realize 1% of $850,000 is $8,500 annually. Most restaurants operate at 4-6% margins. Adding 1% means 16-25% profit increase.
Marcus switched to digital menus: saved $9,480 annually. On $920,000 revenue, that's 1.03 percentage points of margin. His margin went from 5.2% to 6.23%.
Leak #3: Labor Inefficiency (2-4% Revenue Lost)
Bottom quartile restaurants:
- Labor cost: 32-38% of revenue
- Overstaffed at slow times
- Understaffed at peak times (overtime premiums)
- Poor scheduling (last-minute changes)
Top quartile restaurants:
- Labor cost: 25-29% of revenue
- Data-driven scheduling
- Cross-trained staff (flexibility)
- Proper forecasting (reduced overtime)
Difference: 5-8 percentage points of margin
Chen analyzed scheduling data:
- Monday-Thursday: Overstaffed by 2 people (8 hours × $15 = $120 daily waste)
- Friday-Saturday: Understaffed, paying overtime (4 hours × $22.50 = $90 daily)
Weekly waste: $600 ($2,400 monthly / $28,800 annually)
Implemented demand-based scheduling:
- Labor cost dropped from 34% to 28%
- On $680,000 revenue: 6 percentage points = $40,800 annually
Leak #4: Delivery Platform Fees (3-5% Revenue Lost)
Restaurants doing 30-40% delivery sales through platforms:
On $850,000 annual revenue with 35% delivery:
- Delivery sales: $297,500
- Platform fees (33% real cost): $98,175
- As % of total revenue: 11.5%
But platform delivery margins are 18% vs 48% in-restaurant:
- Delivery margin contribution: $53,550
- If same sales were in-restaurant at 48%: $142,800
- Margin lost: $89,250 (10.5% of total revenue)
Top quartile restaurants:
- Direct ordering for 70% of delivery sales
- Platform cost on direct orders: 20%
- Margin recovery: 5-8 percentage points
Maria transitioned 65% of delivery to direct ordering:
- Platform delivery (35%): $104,125 at 33% cost
- Direct delivery (65%): $193,375 at 20% cost
- Margin improvement: 4.8 percentage points on total revenue
Leak #5: Poor Menu Pricing (3-6% Revenue Lost)
Bottom quartile mistakes:
- Prices set by "feel" or competitor matching
- No regular cost analysis
- Ignoring psychological pricing
- Same prices for 2-3 years despite rising costs
Example (Jake's Pizza):
- Margherita pizza food cost: $3.20
- Price: $12 (26.7% food cost - acceptable)
Tomato cost increased 30% over 18 months:
- New food cost: $4.16
- Still priced at $12 (34.7% food cost - losing money)
Multiply across 40 menu items, lose 3-4% margin without realizing it.
Top quartile approach:
- Quarterly cost analysis
- Adjust prices 5-8% annually (aligned with cost increases)
- Menu engineering (promote high-margin items)
- Psychological pricing ($18.95 vs $19.00)
Marcus implemented quarterly pricing reviews:
- 15 items underpriced by 8-12%
- 8 items overpriced by 5-9%
- Rebalanced menu pricing
- Margin improvement: 2.8 percentage points
Leak #6: Energy & Utilities (1-2% Revenue Lost)
Bottom quartile:
- Utilities: 3-4% of revenue
- Old equipment (inefficient)
- No energy monitoring
- Peak-time usage (higher rates)
Top quartile:
- Utilities: 2-2.5% of revenue
- Energy-efficient equipment
- LED lighting (80% reduction)
- Off-peak prep when possible
Difference: 1-1.5 percentage points
Sarah replaced kitchen equipment with Energy Star models:
- Investment: $8,200
- Annual utility savings: $2,640
- Payback: 3.1 years
- On $850,000 revenue: 0.31 percentage points margin
Small but compounds with other improvements.
How to Move From Bottom to Top Quartile
Month 1: Audit Everything
Track for 30 days:
- Daily food waste (by category)
- Labor hours vs revenue by shift
- Menu item profitability
- Utility usage patterns
- Menu printing costs
Don't change anything. Just measure.
Most restaurant owners discover they're losing money in areas they never monitored.
Month 2-3: Fix Biggest Leak First
Priority order (highest impact first):
- Labor efficiency (typically saves 5-8 percentage points)
- Delivery platform costs (saves 3-5 percentage points)
- Food waste (saves 3-5 percentage points)
- Menu pricing (saves 2-4 percentage points)
- Menu printing (saves 0.8-1.2 percentage points)
Jake focused on labor first:
- Month 1 margin: 4.2%
- Implemented demand-based scheduling
- Month 3 margin: 7.8%
- Improvement: 3.6 percentage points
Then tackled food waste:
- Month 6 margin: 11.4%
- Cumulative improvement: 7.2 percentage points
Month 4-6: Compound Multiple Improvements
Attack multiple leaks simultaneously once first major leak fixed.
Chen's progression:
- Baseline: 3.8% margin
- Month 3 (labor): 7.2% (+3.4 points)
- Month 6 (waste): 10.1% (+2.9 points)
- Month 9 (delivery): 13.4% (+3.3 points)
- Month 12 (pricing): 14.8% (+1.4 points)
Total improvement: 11 percentage points.
On $680,000 revenue:
- 3.8% margin = $25,840 net profit
- 14.8% margin = $100,640 net profit
- Improvement: $74,800 annually
Same restaurant. Same food. Different systems.
Benchmarks Worth Watching
Prime Cost (Food + Labor)
Industry standard: 60-65% of revenue Top performers: 52-58% of revenue
If your prime cost exceeds 65%, you have zero room for error. One slow month bankrupts you.
Break-Even Point
Bottom quartile: 75-85% of capacity Top quartile: 55-65% of capacity
Lower break-even means surviving slow months and thriving during peak.
Revenue Per Labor Hour
Casual dining benchmarks:
- Bottom quartile: $40-50 per labor hour
- Average: $60-70 per labor hour
- Top quartile: $80-100 per labor hour
If you're below $60/hour, you're overstaffed or underpriced.
Food Cost Percentage
By restaurant type:
- Quick-service: 25-30%
- Casual dining: 28-32%
- Fine dining: 32-38%
Lower isn't always better. 22% food cost might mean tiny portions or low-quality ingredients destroying customer satisfaction.
Common Questions
Q: Can restaurants really operate at 15% margins?
Yes, but requires excellence across multiple areas. No single change gets you there. Combination of labor efficiency, waste reduction, smart pricing, direct delivery, and operational excellence compounds to 15%. Achievable but requires discipline.
Q: What's a healthy margin for my restaurant type?
Quick-service: 10-14%, Casual dining: 6-10%, Fine dining: 5-9%, Food trucks: 15-20%. If you're below these ranges, identify and fix your largest margin leak first.
Q: How often should I raise prices?
Annually minimum, quarterly ideal. Small frequent increases (3-5%) beat large rare increases (15-20%). Customers adjust to gradual changes. Sudden jumps drive customer loss.
Q: Should I cut labor to improve margins?
Only if you're genuinely overstaffed. Understaffing kills customer experience, generates bad reviews, loses revenue. Better approach: improve scheduling efficiency without reducing service quality.
Q: What if I can't improve margins?
Then you're in wrong location, wrong concept, or wrong market. Healthy restaurants in sustainable markets can achieve 6-12% margins. If you're stuck at 2% despite fixing operational leaks, the business model itself is broken.
Bottom Line on Restaurant Margins
Average margin (3-6%) represents mediocrity, not inevitability.
Top quartile margins (12-15%) come from compound improvements:
- Labor efficiency: +5 points
- Waste reduction: +3 points
- Direct delivery: +3 points
- Smart pricing: +2 points
- Operational efficiency: +1 point
That's 14 percentage points total. On $850,000 revenue:
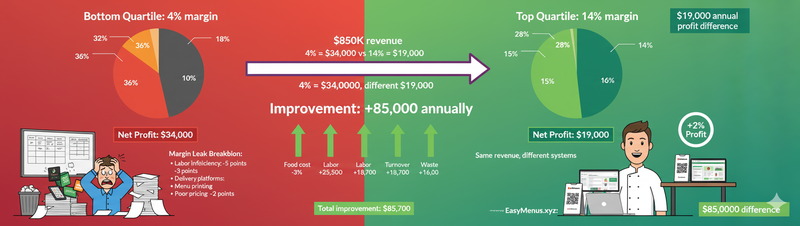
- 4% margin = $34,000 net profit
- 18% margin = $153,000 net profit
- Difference: $119,000 annually
Same restaurant. Same market. Different systems.
The question isn't "can I improve margins?" The question is "which leak do I fix first?"
Start with labor (biggest impact). Then food waste. Then delivery costs. Compound improvements over 12 months.
Your margin won't reach 18% overnight. But it'll move from 4% to 10-12% within a year if you fix the leaks systematically.
And that 6-8 percentage point improvement? That's the difference between barely surviving and actually building wealth.